library(readxl)
library(sf)
library(tidyverse)
library(scales)
library(mapview)
library(formatR)

ntd <- read_excel(
  "../data/February 2023 Complete Monthly Ridership (with adjustments and estimates).xlsx",
  sheet = "Master")

apta_fares <- read_excel("../data/APTA-2022-Fare-Database.xlsx",
sheet = "Fixed-Route-Fares")Analyzing NTD and APTA data
Introduction
The National Transit Database (NTD) is administered by the Federal Transit Administration and serves as “the repository of data about the financial, operating and asset conditions of American transit systems.” It offers fine-grained data about ridership and revenue at every transit agency that receives federal funding, broken down by mode and type of service.
APTA’s Public Transportation Fare Database, meanwhile collects data on fare structure and fare payment options (among many other variables). APTA is a non-profit public transportation industry association and this data is reported by its members.
The NTD collects data on revenue from fares collected on each mode within an agency, however it does not require respondents to indicate how revenue is collected. It might be interesting to know, and map, fare payment media – how people pay to ride transit – at the busiest transit agencies in the U.S. by unlinked passenger journeys.
To do this we will join the NTD and APTA datasets. This will take a good amount of summarization and simplification of each dataset. Then, we have a tricky merge operation since these data do not share a primary key. More on that later.
Let’s start by reading in the data, using Hadley Wickham’s readxl pacakge.
Data cleaning and summarization
Each dataset requires some cleaning operations unique to them. We’ll start with the APTA data, which includes information from Canadian transit agencies, agencies that haven’t reported in quite some time, and modes (such as demand response) that we are not interested in. We will also select out a few dozen variables from the over 150 available in the data.
#first lets get rid of Canada
apta_fares_us <- filter(apta_fares, Country == "US")

#we will take agencies that haven't reported since as far back as 2016,
#since there are some important systems in there (e.g. MARTA)
years <- as.character(2016:2022)

#these are column indices for the variables we want to explore
vars <- c(1, 5, 6, 9, 10, 69:72, 86:98, 121:125, 132:135, 137, 144:147, 152:154)

#these are the modes we are interested in. we are leaving out on demand services.
modes <- c("CC", "CR",
           "HR", "YR",
           "LR", "MG",
           "SR", "TR",
           "CB", "MB",
           "RB", "FB",
           "JT", "TB")

apta_fares_us <- apta_fares_us %>% filter(`Last Submission Date` %in% years,
`Mode Code` %in% modes)%>%
  select(all_of(vars)) %>%
  #renaming this var will help keep our join operations organized
  rename(apta_agency = "Transit System Name")
The NTD has data on both “active” and “inactive” agencies. We want to filter out the inactive agencies, similar to how we only kept agencies that have recently reported to APTA. We also will filter for the same modes. Thankfully, APTA uses the same mode codes as the NTD.
#filter only active agencies + modes we are interested in
ntd <- ntd %>% filter(Mode %in% modes,
                      Status == "Active") %>%
  rename(ntd_agency = Agency)
In the next chunk, we will rename some transit agencies across both datasets. A number of the values in ntd_agency and apta_agency are 1:1, but many are not. For example, Denver’s Regional Transportation District is “Denver Regional Transportation District” in the NTD table, and merely “Regional Transportation District” in the APTA table.
While the level of detail in both datasets is useful for many applications, this analysis demands some simplification. Having ridership values spread across modes in the NTD data set could make some agencies appear “less busy” in our final plot. In the following summaries, we basically aggregate the data for each mode into a single row for each agency. First, the agencies are grouped by their unique IDs in each table. For qualitative variables, we will take the first value in each group. For totals like unlinked passenger trips, we will calculate a sum. For averages, like average fare per trip, we will calculate the mean. The column positions are saved as a character vector based on how they will be aggregated. The character vectors are then passed to summarise, which incorporates “across” to apply the same calculation across the appropriate variables. Finally, we will drop the Mode and Type of Service columns, since we no longer need them.
#summarise down to one row per agency

#APTA

#qualitative variables; we'll take the of these for each group
first_values <- c(1:27, 29:36)
max_values <- c(28, 36:38)

apta_fares_us <- apta_fares_us %>%
  group_by(apta_agency) %>%
  summarise(across(all_of(first_values),
  ~ first(.x, na_rm = TRUE)),
  across(all_of(max_values), max))

apta_fares_us <- select(apta_fares_us,
                        -c(`Mode Code`))


##NTD
#qualitative variables
first_values_ntd <- c(1:14, 17:19)
max_values_ntd <- c(15, 16)
#ridership and revenue figures by mode that we will sum
sum_values_ntd <- c(20, 21, 23, 24)
#averages across modes that we will take the mean of
mean_values_ntd <- c(22, 25)

ntd_summ <- ntd %>% group_by(`NTD ID`) %>%
  summarise(across(all_of(first_values_ntd), first),
  across(all_of(max_values_ntd), max),
  across(all_of(mean_values_ntd), mean),
  across(all_of(sum_values_ntd), sum)) %>%
  select(-c(`Mode`, TOS))
Next, some more cleaning of the APTA data. In a little bit, we will try to match agency names, and matches are case-sensitive. I will convert the agency name column in both datasets to Title Case, ironing out all the inconsistencies like “Of” vs. “of”. I also convert valeues in the City column to all-caps. Finally, I will create a vector of agencies that will be removed. These are agencies that are “inactive” reporters to the NTD. This takes the APTA table down to 223 rows.
#store inactive reporters in a vector
remove <- str_to_title(c("Simi Valley Transit", "County of Hawai'i Mass Transit Agency",
"Owensboro Transit System",
"Battle Creek Transit",
"Muskegon Area Transit System",
"Allen County Regional Transit Authority",
"Area Transportation Authority of North Central Pennsylvania",
"Roaring Fork Transportation Authority", "City of Las Cruces-RoadRUNNER Transit",
"Community Action of Southern Kentucky, Inc.",
"Park City Transit",
"Lymo Waccamaw Regional Transportation  Authority",
"Macon-Bibb County Transit Auth",
"Lawton Area Transit System",
"Mesa County Reg Transp Office",
"Go West Transit",
"Mississippi State University",
"Franklin Transit Authority",
"Pasco County Public Transportation",
"Fredericksburg Regional Transit",
"City of McAllen",
"North Central Regional Transit District",
"Edmond Transit Management, Inc.",
"Orange County Public Transportation",
"Ark-Tex Rural Transit District",
"City of Murfreesboro",
"City of Manteca",
"Kootenai County Public Transportation",
"High Valley Transit",
"Georgia Regional Trp Auth",
"Link Transit (City Of Burlington, Nc)",
"Colorado Department of Transportation",
"Ladot - Commuter Express",
"Los Alamos County, Atomic City Transit",
"City Of Atlanta",
"Hazleton Public Transit",
"Mid-Ohio Valley Transit Authority",
"Midland Odessa Urban Transit District",
"Mountain Rides Transportation Authority",
"Port Arthur Transit",
"Glendale Transit"))

#sentence case for agency names, upper case for city names
apta_fares_us$apta_agency <- str_to_title(apta_fares_us$apta_agency)
apta_fares_us$City <- str_to_upper(apta_fares_us$City)

#remove inactive reporters
apta_fares_us <- apta_fares_us %>%
  filter(!apta_agency %in% remove)

nrow(apta_fares_us)
[1] 214I’ll do some similar cleaning operations on the summarized NTD table: convert the Agency column to title case, city to upper-case, and remove inactive reporters, reduced asset reporters and small systems reporters. Finally, I make a new table that has just the remaining NTD agency names and their NTD IDs.
ntd_summ$ntd_agency <- str_to_title(ntd_summ$ntd_agency)

status <- c("Inactive")
type <- c("Reduced Asset Reporter",
          "Small Systems Reporter")

ntd_summ <- ntd_summ %>% filter(Status == "Active", !`Reporter Type` %in% type)

ntd_summ$`HQ City`<- str_to_upper(ntd_summ$`HQ City`)

#create ntd agencies/ID table
key_vars <- c("ntd_agency",
              "NTD ID",
              "HQ City")

ntd_agencies <- ntd_summ %>% select(all_of(key_vars))

nrow(ntd_agencies)
[1] 477Joining the data
I guess it’s a good time to talk about how I joined these tables with no primary key. For the script, you can check out ntd_apta_scratch.r in the src folder. I basically iterated. I matched about 60 rows joining on agency name alone. I then matched on the agency names using a partial string, getting a few dozen more matches. I was still missing a number of major agencies, such as RTD in Denver. I then matched based on City which was fairly successful for the remaining hundred or so rows. However a number of duplicates occurred in the join – this makes sense since city names aren’t unique, nor is it uncommon that cities have multiple transit operators. At this point, I just made a list of the mismatched agency names that I would use to recode the data. This was clunky and done by hand but ultimately it worked. I went from matching 60 of 220+ APTA agencies to the 400+ agencies in the NTD, to matching almost all the APTA agencies to the NTD. I will be updating this project soon for a full accounting of excluded agencies.
#create ntd agencies/ID table
key_vars <- c("ntd_agency", "NTD ID", "HQ City")

ntd_agencies <- ntd_summ %>% select(all_of(key_vars))
In the next chunk, we will create two character vectors of equivalent agency names (title case to be certain). We’ll combine them together in a dataframe. I found a total of 102 mismatched agency names.
#create recoding table
apta_c <- str_to_title(c("San Francisco Municipal Railway",
"Starmetro - City Of Tallahassee",
"Citybus Of Greater Lafayette",
"Indianapolis Public Transportation Corporation",
"City of Detroit Department of Transportation",
"Ann Arbor Transportation Authority",
"City Utilities Of Springfield, Mo",
"Red Rose Transit Authority",
"Rhode Island Public Ta",
"Snohomish County Ptba",
"Greensboro Transit Authority",
"Madison Metro Transit System",
"Milwaukee County Transit System",
"Mta Metro-North Railroad",
"Mta Staten Island Railway",
"Norwalk Transit System",
"Sonoma Marin Area Rail Transit District (Smart)",
"Valley Metro",
"Goraleigh",
"Seattle Department Of Transportation",
"Sound Transit",
"Visalia City Coach",
"Durham Area Transit Authority (Data)",
"City Of Fairfax Cue Bus",
"Dallas Area Rapid Transit Authority",
"Arlington Transit (Art)",
"Metropolitan Atlanta Rapid Transit Authority",
"Central Midlands Regional Transit Authority",
"Regional Transportation Commission",
"King County Department of Transportation",
"Central Arkansas Transit Auth",
"Regional Transportation District",
"Port Authority of New York and New Jersey",
"Madison County Transit",
"Santa Fe Transit Services",
"Ventura County Transp Comm",
"River Valley Metro MTD",
"Fort Bend Transit",
"Greater New Haven Transit District",
"North East Transportation Company, Inc.",
"City of Gardena G-Trans",
"Miami-Dade Transit Agency",
"Broward County Division Of Mass Transit",
"Culver City Municipal Bus Lines",
"Fairfield/Suisun Transit System",
"Santa Monica's Big Blue Bus",
"Gold Coast Transit",
"Torrance Transit System",
"University Transport System",
"Palmtran",
"City And County Of Honolulu Department Of Transportation Services",
"Muncie Public Transportation Corporation",
"Wichita Transit",
"Lextran",
"Regional Transit Authority",
"Kalamazoo Transportation Division",
"Saint Cloud Metropolitan Transit Commission",
"Metro",
"Chapel Hill Transit",
"Charlotte Area Transit System",
"Greater Cleveland Regional Transit Authority",
"Salem-Keizer Transit",
"River Valley Transit",
"York County Transportation Authority",
"Sioux Area Metro",
"Knoxville Area Transit",
"Memphis Area Transit Authority",
"Citibus",
"Trinity Metro",
"El Paso Mass Transit Dept",
"Pierce Transit",
"Tri-State Transit Authority",
"Valley Transit",
"Dutchess County Public Transit",
"Blacksburg Transit",
"Eastern Contra Costa Transit Authority",
"Pace Suburban Bus Division",
"Livermore/Amador Valley Transit Authority",
"Montgomery County Transit Services",
"Lee Tran",
"Prince George's County Department Of Public Works & Transportation",
"Chelan-Douglas Ptba (Link)",
"Santa Clarita Transit",
"Portage Area Reg Trp Auth",
"Southwest Metro Transit Commission",
"Mountain Metropolitan Transit",
"Gwinnett County Dot",
"City Of Modesto Transit Division",
"Delaware Area Transit Agency",
"Hall Area Transit",
"Ozaukee County Transit Services",
"City Of Brownsville Multimodal Transportation",
"Clemson Area Transit",
"Denton County Transportation Auth",
"Anaheim Resort Transportation",
"Green Bay Metro Transit",
"Mountain Line Transit Authority",
"Yuma County Intergovernmental Pta",
"Solano County Transit (Soltrans)",
"Cumberland-Dauphin-Harrisburg Transit Authority",
"Everett Transit",
"Green Mountain Transit",
"Manatee County Area Transit",
"Metropolitan Transit Authority Of Harris County",
"South Bend Public Transporation Corporation",
"Piedmont Authority For Regional Transportation (Part)",
"Sarasota County Area Transit"
))
#NTD
ntd_c <- str_to_title(c("City And County Of San Francisco",
"City Of Tallahassee",
"Greater Lafayette Public Transportation Corporation",
"Indianapolis And Marion County Public Transportation",
"City Of Detroit",
"Ann Arbor Area Transportation Authority",
"City Of Springfield",
"South Central Transit Authority",
"Rhode Island Public Transit Authority",
"Snohomish County Public Transportation Benefit Area Corporation",
"City Of Greensboro",
"City Of Madison",
"Milwaukee County",
"Metro-North Commuter Railroad Company, Dba: Mta Metro-North Railroad",
"Staten Island Rapid Transit Operating Authority",
"City Of Norwalk",
"Sonoma-Marin Area Rail Transit District",
"Valley Metro Rail, Inc.",
"City Of Raleigh",
"City Of Seattle",
"Central Puget Sound Regional Transit Authority",
"City Of Visalia",
"City Of Durham",
"City Of Fairfax",
"Dallas Area Rapid Transit",
"Arlington County, Virginia",
"Metropolitan Atlanta Rapid Transit Authority",
"Central Midlands Regional Transportation Authority",
"Regional Transportation Commission of Washoe County",
"King County Department of Metro Transit",
"Rock Region Metropolitan Transit Authority",
"Denver Regional Transportation District",
"Port Authority Trans-Hudson Corporation",
"Madison County Transit District",
"City of Santa Fe",
"Ventura County Transportation Commission",
"River Valley Metro Mass Transit District",
"Fort Bend County, Texas",
"Connecticut Department of Transportation - CTTRANSIT New Haven Division",
"Connecticut Department of Transportation- CTTransit Waterbury- NET",
"City Of Gardena",
"County Of Miami-Dade",
"Broward County Board Of County Commissioners",
"City Of Culver City",
"City Of Fairfield, California",
"City Of Santa Monica",
"Gold Coast Transit District",
"City Of Torrance",
"University Of California, Davis",
"Board Of County Commissioners, Palm Beach County",
"City And County Of Honolulu",
"Muncie Indiana Transit System",
"City Of Wichita",
"Lexington Transit Authority",
"New Orleans Regional Transit Authority",
"Central County Transportation Authority",
"St. Cloud Metropolitan Transit Commission",
"Bi-State Development Agency Of The Missouri-Illinois Metropolitan District",
"Town Of Chapel Hill",
"City Of Charlotte North Carolina",
"The Greater Cleveland Regional Transit Authority",
"Salem Area Mass Transit District",
"City Of Williamsport",
"Central Pennsylvania Transportation Authority",
"Su Tran Llc",
"City Of Knoxville",
"City Of Memphis",
"City Of Lubbock",
"Fort Worth Transportation Authority",
"City Of El Paso",
"County Of Pierce",
"Town Of Huntington",
"City Of Appleton",
"Dutchess County",
"Town Of Blacksburg",
"The Eastern Contra Costa Transit Authority",
"Pace - Suburban Bus Division",
"Livermore / Amador Valley Transit Authority",
"Montgomery County, Maryland",
"Lee County Transit",
"Prince George's County, Maryland",
"Chelan Douglas Ptba",
"City Of Santa Clarita",
"Portage Area Regional Transportation Authority",
"Southwest Transit",
"City Of Colorado Springs",
"Gwinnett County Board Of Commissioners",
"Stanislaus Regional Transit Authority",
"Delaware County Transit Board",
"City Of Gainesville, Fl",
"Ozaukee County",
"City Of Brownsville",
"City Of Clemson",
"Denton County Transportation Authority",
"Anaheim Transportation Network",
"City Of Green Bay",
"West Virginia University - Morgantown Personal Rapid Transit",
"Yuma County Intergovernmental Public Transportation Authority",
"Solano County Transit",
"Cumberland Dauphin-Harrisburg Transit Authority",
"City Of Everett",
"Green Mountain Transit Authority",
"Manatee County Board Of County Commissioners",
"Metropolitan Transit Authority Of Harris County, Texas",
"South Bend Public Transportation Corporation",
"Piedmont Authority For Regional Transportation",
"Sarasota County"
))
recode <- data.frame(apta_c = apta_c, ntd_c = ntd_c)
nrow(recode)[1] 107Here’s where the merge finally happens. First, I join recode to the APTA fares table. This creates two new columns in the APTA table, apta_c and ntd_c. The join is based on the apta_agency column in x and apta_c in y. In the new apta_c column, there are values that match apta_agency (n = 102) and NA for all others. The ntd_c column has their attendant values in the NTD dataset, and NA for all others. if_else is used to to replace values in apta_agency that have a match in apta_c with values from ntd_c for rows without an NA in ntd_c.
#joining up tables

#first, the recode table to the apta table
apta_fares_us_rc <- full_join(apta_fares_us,
                              recode,
                              join_by(apta_agency == apta_c))

#this recodes the apta_agency column with values from the ntd_c column
apta_fares_us_rc <- apta_fares_us_rc %>%
  mutate(apta_agency = ifelse(!is.na(ntd_c),
                              ntd_c,
                              apta_agency))

#join based on our new primary key, agency name
apta_ntd <- left_join(apta_fares_us_rc,
                      ntd_summ,
                      join_by(apta_agency == ntd_agency))

nrow(apta_ntd)
[1] 214Our re-coded table has 214 rows, the same as our simplified apta_fares_us table.
Visualizing NTD and APTA data
Now we can easily grab the top 20 busiest agencies by unlinked passenger trips for the last fiscal year – an NTD variable – and, using variables from the NTD, classify them based on whether or not they use smartcards as fare payment media.
top_agencies <- slice_max(apta_ntd,
                          order_by = `Unlinked Passenger Trips FY`,
                          n = 20 )
#change NA to 'no'
top_agencies$`Computer-chip Cards or Passes Used`[is.na(top_agencies$`Computer-chip Cards or Passes Used`)] <- "No"
top_agencies$`Unlinked Passenger Trips FY` <- round(top_agencies$`Unlinked Passenger Trips FY`)
Using our new table of Top Agencies by Passenger trips, we can make a graph.
ggplot(top_agencies,
       aes(x = reorder(apta_agency, `Unlinked Passenger Trips FY`),
           y = `Unlinked Passenger Trips FY`))+
  geom_col(aes(fill = `Computer-chip Cards or Passes Used`)) +
  coord_flip() +
  scale_fill_brewer(direction = 1, palette = "Greens",
                    labels = label_wrap(10))+
    xlab("Agency") +
  scale_y_continuous(name = "Unlinked Passenger Trips",
                     labels = label_number(big.mark =","),
                     breaks=c(25000000, 1500000000)) +
    theme(
      panel.grid.major.y = element_blank(),
      panel.grid.minor.y = element_blank(),
      panel.background = element_blank(),
      #panel.grid.major.x=element_blank(),
      axis.text.x  = element_text(angle=45,
                                  vjust=0.5,
                                  size=8),
      axis.text.y = element_text(angle=40,
                                 vjust=0.1,
                                 size = 6),
      legend.title = element_text(size = 8),
      legend.text = element_text(size = 7),
      legend.position="bottom"
    ) +
  ggtitle("Smartcard Use at Top 20 Agencies Ranked by Unlinked Passenger Trips")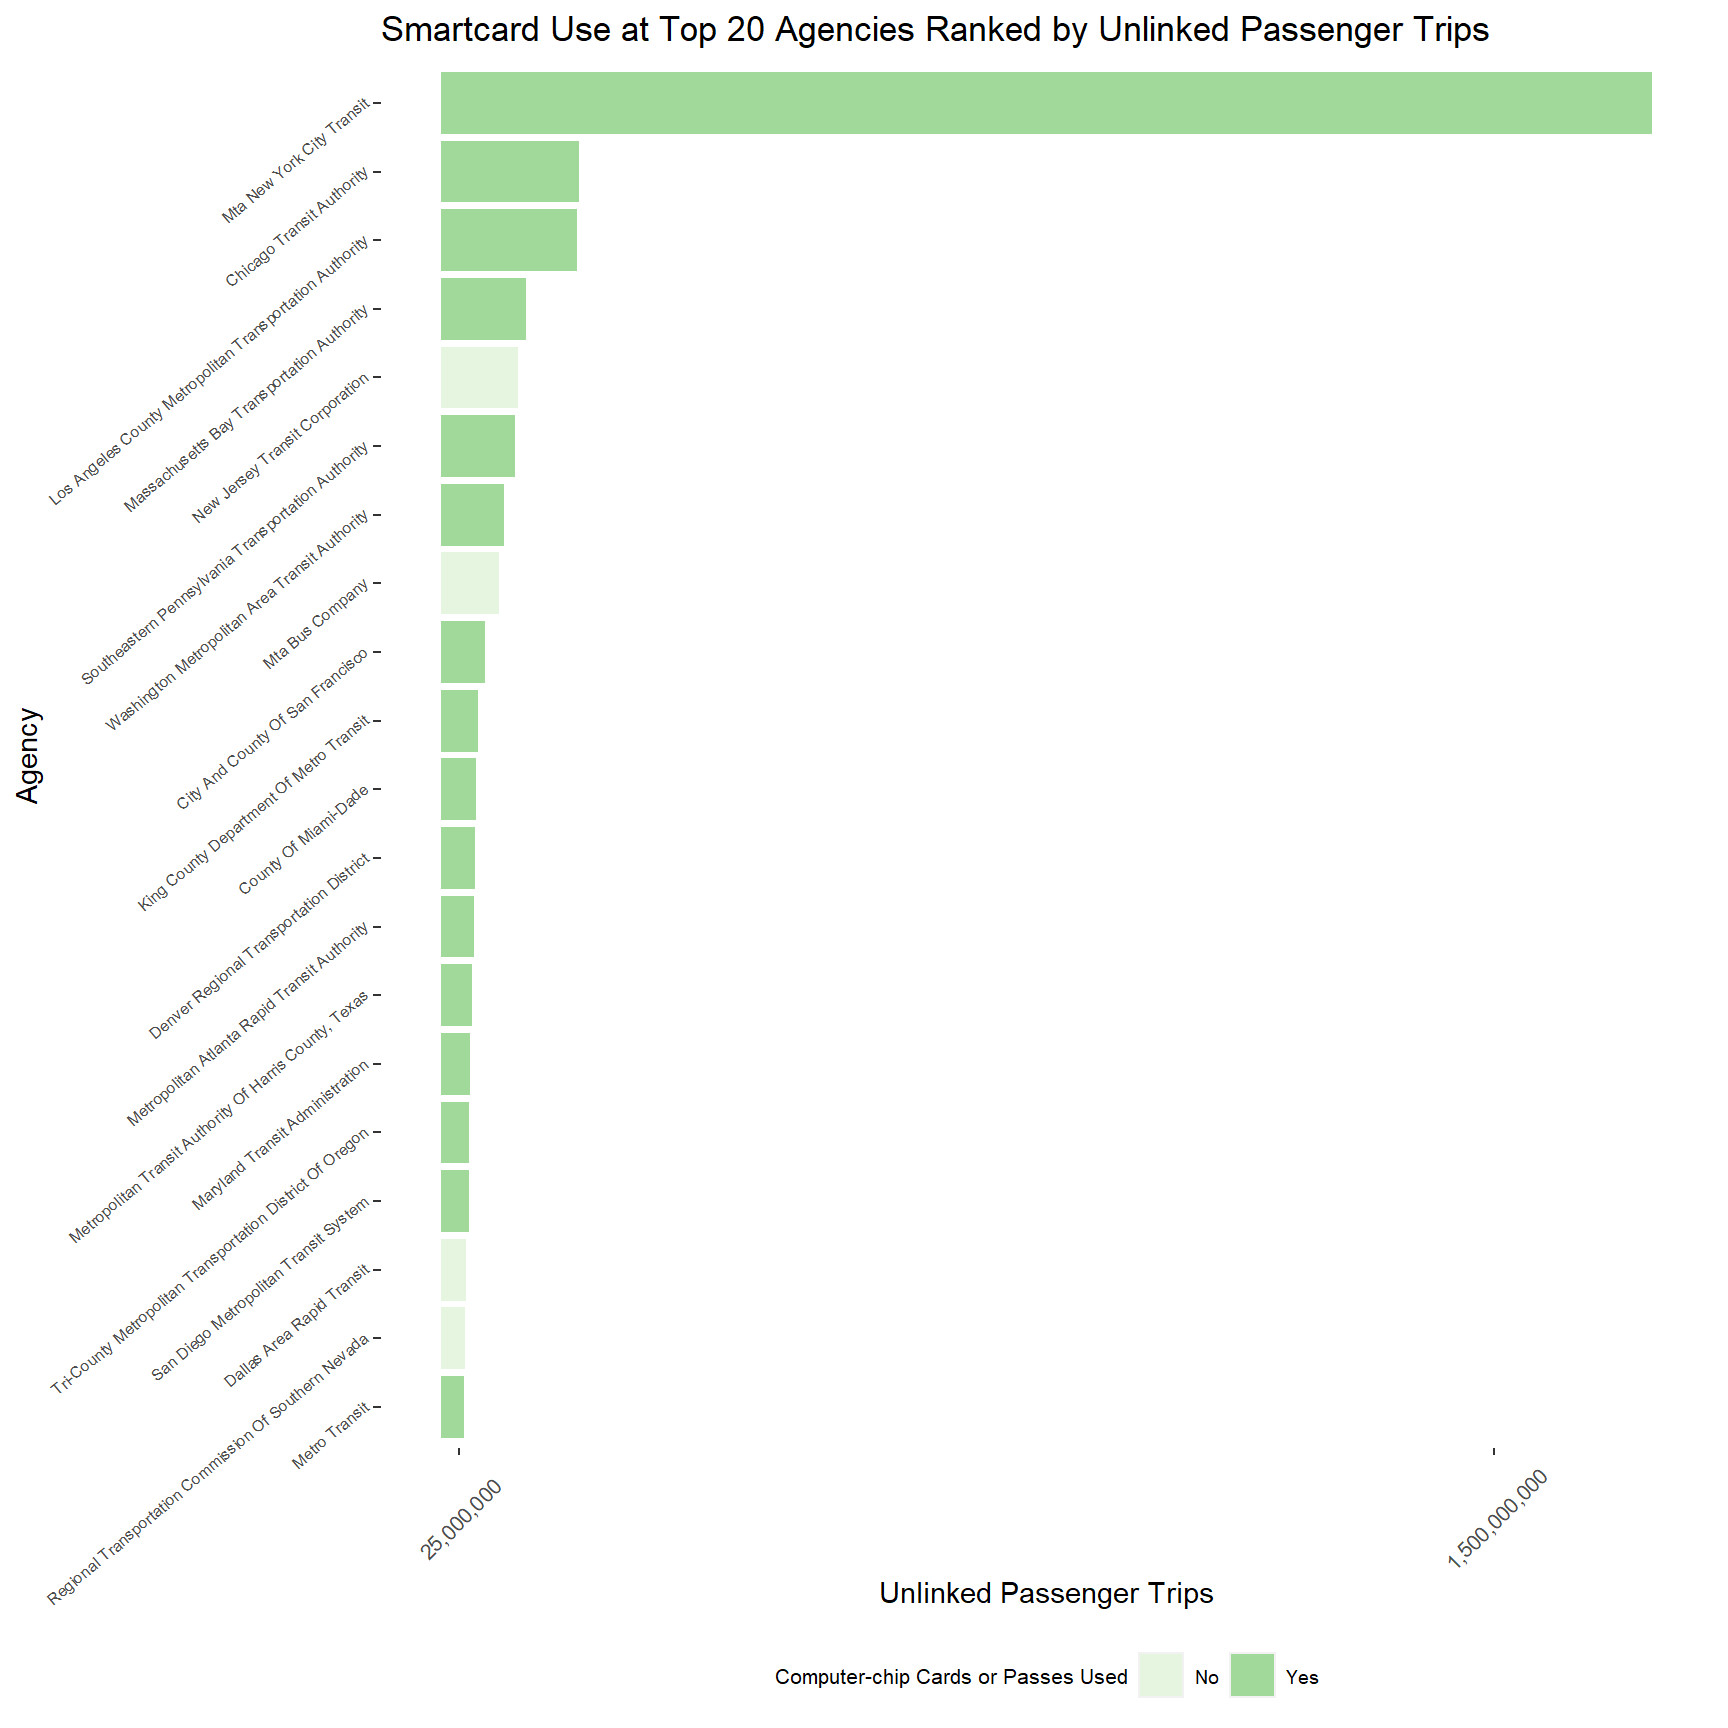
New York absolutely smokes other U.S. transit agencies, with over 1.7 billion unlinked trips in the last FY. Let’s log the unlinked trips values so we have something slightly more legible…
ggplot(top_agencies, aes(x = reorder(apta_agency, `Unlinked Passenger Trips FY`),
                         y = `Unlinked Passenger Trips FY`)) +
  geom_col(aes(fill = `Computer-chip Cards or Passes Used`)) +
  coord_flip() +
  scale_fill_brewer(direction = 1,
                    palette = "Greens",
                    labels = label_wrap(10)) +
    xlab("Agency") +
  scale_y_continuous(name = "Unlinked Passenger Trips",
                     labels = label_number(big.mark =","),
                     breaks=c(500000, 25000000, 1500000000),
                     trans = "log10") +
    #scale_x_discrete(name = "Agency",
                     #labels=label_wrap(10)) +
    theme(
      panel.grid.major.y = element_blank(),
      panel.grid.minor.y = element_blank(),
      panel.background = element_blank(),
      #panel.grid.major.x=element_blank(),
      axis.text.x  = element_text(angle=45,
                                  vjust=0.5,
                                  size=8),
      axis.text.y = element_text(angle=40,
                                 vjust=0.1,
                                 size = 6),
      legend.title = element_text(size = 8),
      legend.text = element_text(size = 7),
      legend.position="bottom"
    ) +
  ggtitle("Smartcard Use at Top 25 Agencies Ranked by
          Unlinked Passenger Trips")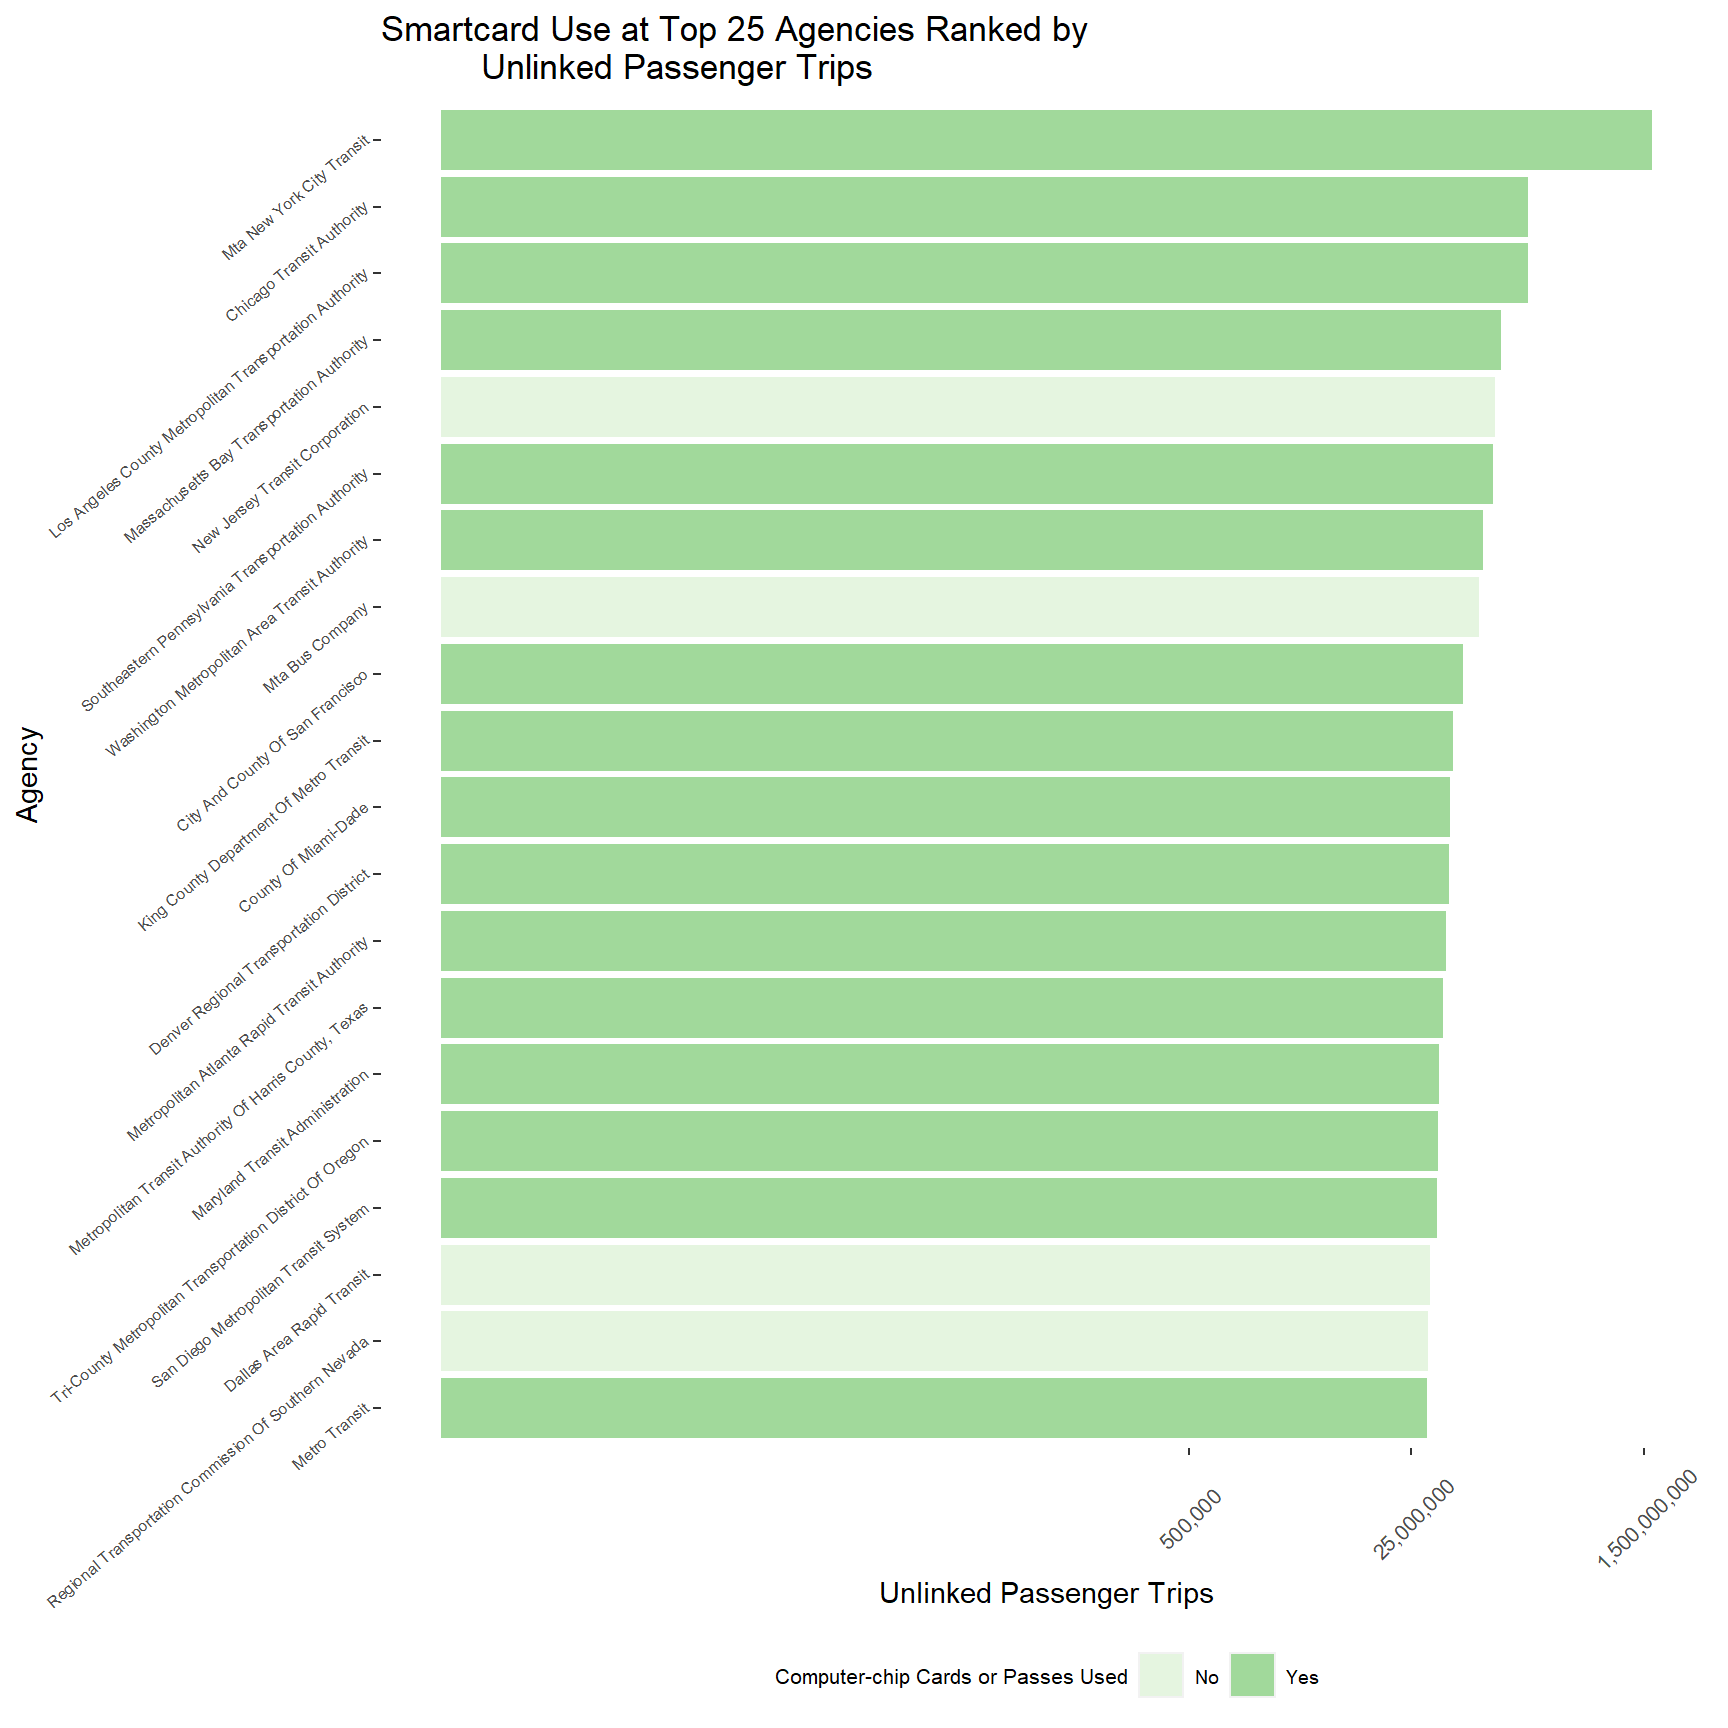
Or is it less legible? I’m not really too sure just yet.
How does smartcard use vary across transit agencies where they are in use? We can take a look at that with another bar chart. This time we will filter the data down to just agencies that responded “Yes” to “Computer-chip cards or Passes Used.”
apta_ntd %>%
  filter(`Computer-chip Cards or Passes Used` == "Yes") %>%
  slice_max(`Percent of trips using smart card`, n = 40) %>%
  ggplot(aes(x =  reorder(apta_agency,
                          `Percent of trips using smart card`),
             y = `Percent of trips using smart card`,
             fill = `Percent of trips using smart card`)) +
  xlab("Agency")+
  geom_col() +
  scale_fill_viridis_c()+
  coord_flip() +
  theme(legend.position="bottom",
        axis.text.y = element_text(angle=40,
                                   vjust=0.1,
                                   size = 8),
        axis.title.x = element_blank(),
        axis.text.x = element_blank()) +
  ggtitle("Rider adoption of smartcards")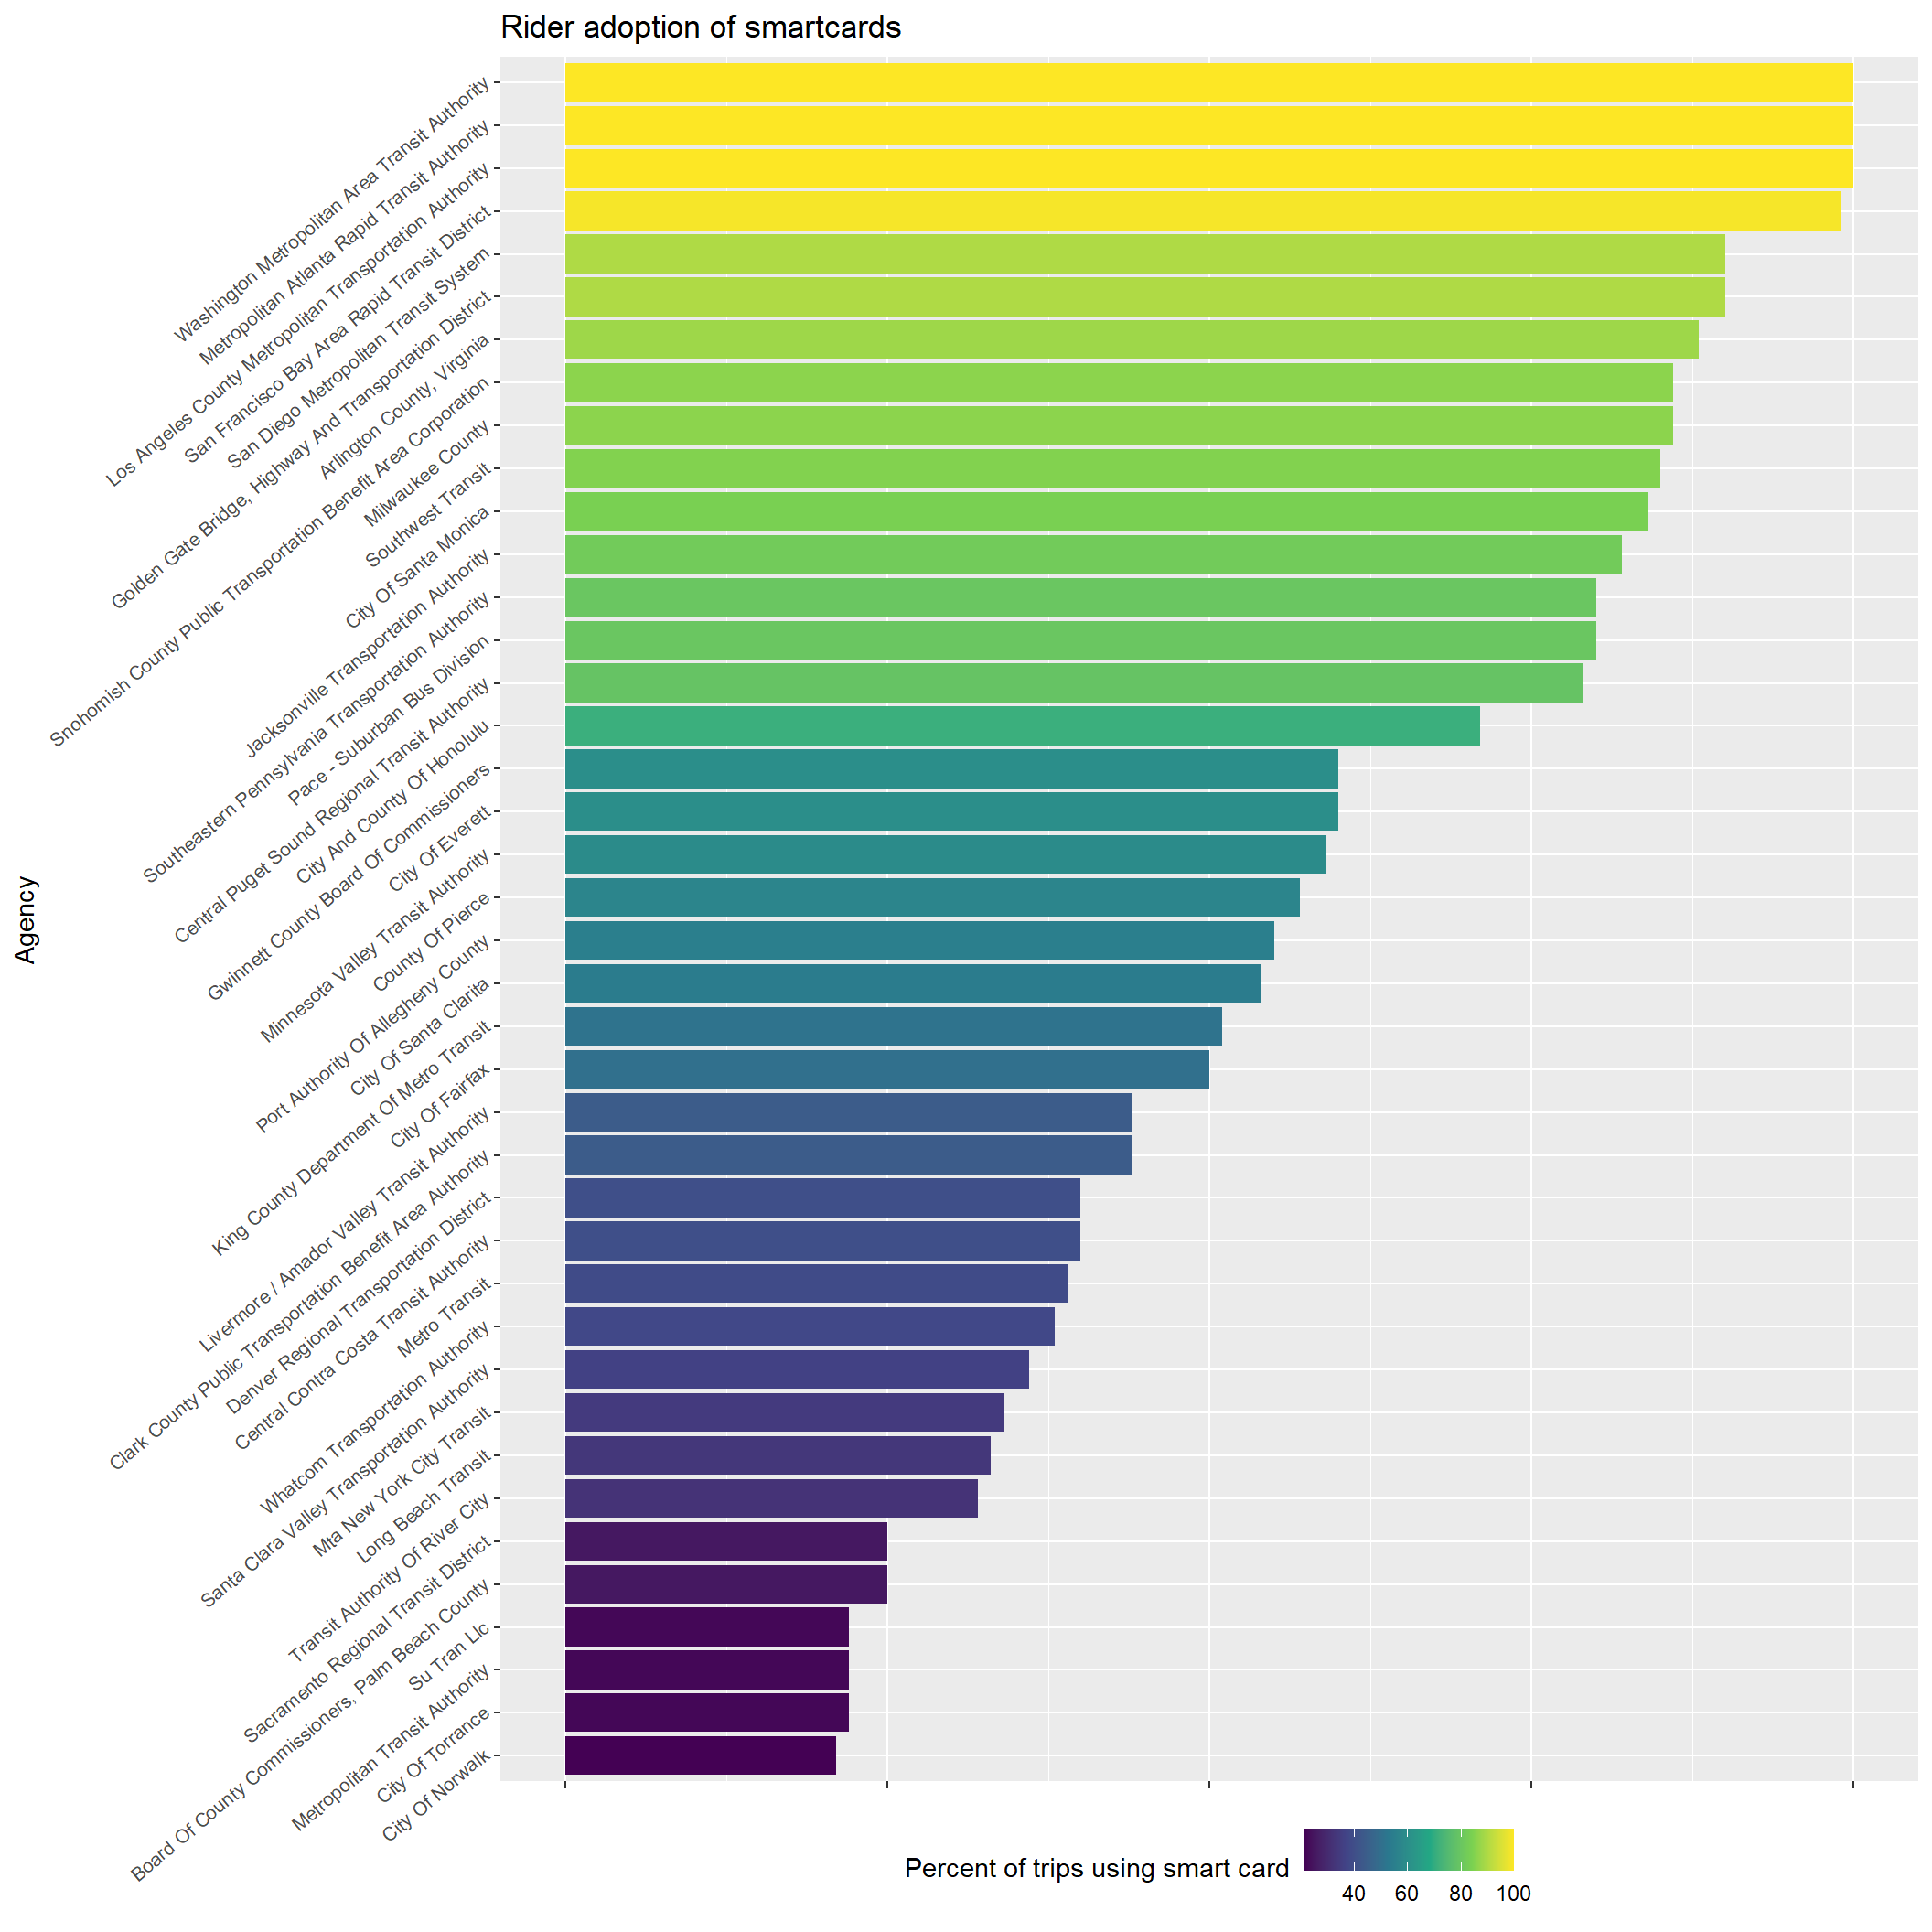
I took the top 40 agencies by smartcard adoption (of the 90 agencies that responded “Yes” to “computer-chip Cards or Passes Used”). We can see smartcards are fully entrenched in systems like WMATA and MARTA, who intitally rolled-out their smartcards in the early 2000s. Meanwhile, MTA NYC, despite having by far the busiest system nationwide, has 34% smartcard adoption. This is likely due to the fact that Omny is only a few years old, and is part of a large suite of payment options that also includes open loop (NFC-chipped cards and phones) and the classic magnetic-striped Metrocard.
Next, let’s compare total fares received per fiscal year, to operating expenses. These figures are used to calculate a ratio of farebox recovery – the percentage of transit operations revenue that is “paid for” by rider fares. Typically, these ratios are quite small, with fares only making up about 1/3 of operations revenue nationwide. What does it look like when we plot these on a scatter?
ggplot(apta_ntd, aes(x=`Fares FY`, y=`Operating Expenses FY`, color = `Adult Base Fare`)) +
  scale_x_continuous(name = "Fares, FY",
                     labels = label_number(big.mark =",")) +
  scale_y_continuous(name = "Operating Expenses, FY",
                     labels = label_number(big.mark =","))+
  ggtitle(label = "Farebox Recovery, U.S. Transit Agencies, 2021") +
  scale_colour_viridis_c() +
  geom_point()


ggplot(top_agencies, aes(x=`Fares FY`, y=`Operating Expenses FY`, color = `Adult Base Fare`)) +
  scale_x_continuous(name = "Fares, FY",
                     labels = label_number(big.mark =",")) +
  scale_y_continuous(name = "Operating Expenses, FY",
                     labels = label_number(big.mark =",")) +
  ggtitle(label = "Farebox Recovery, Top 25 U.S. Transit Agencies by Unlinked Trips, 2022") +
  scale_colour_viridis_c() +
  geom_point()

ggplot(apta_ntd, aes(x=`Avg Fares Per Trip FY`, y=`Avg Cost Per Trip FY`, color = `Adult Base Fare`)) +
  ylab(label = "Avg. cost per trip, FY") +
  xlab(label = "Avg. fare, FY") +
  ggtitle(label = "Farebox recovery (per trip), U.S. Transit Agencies, 2022") +
  scale_colour_viridis_c() +
  geom_point()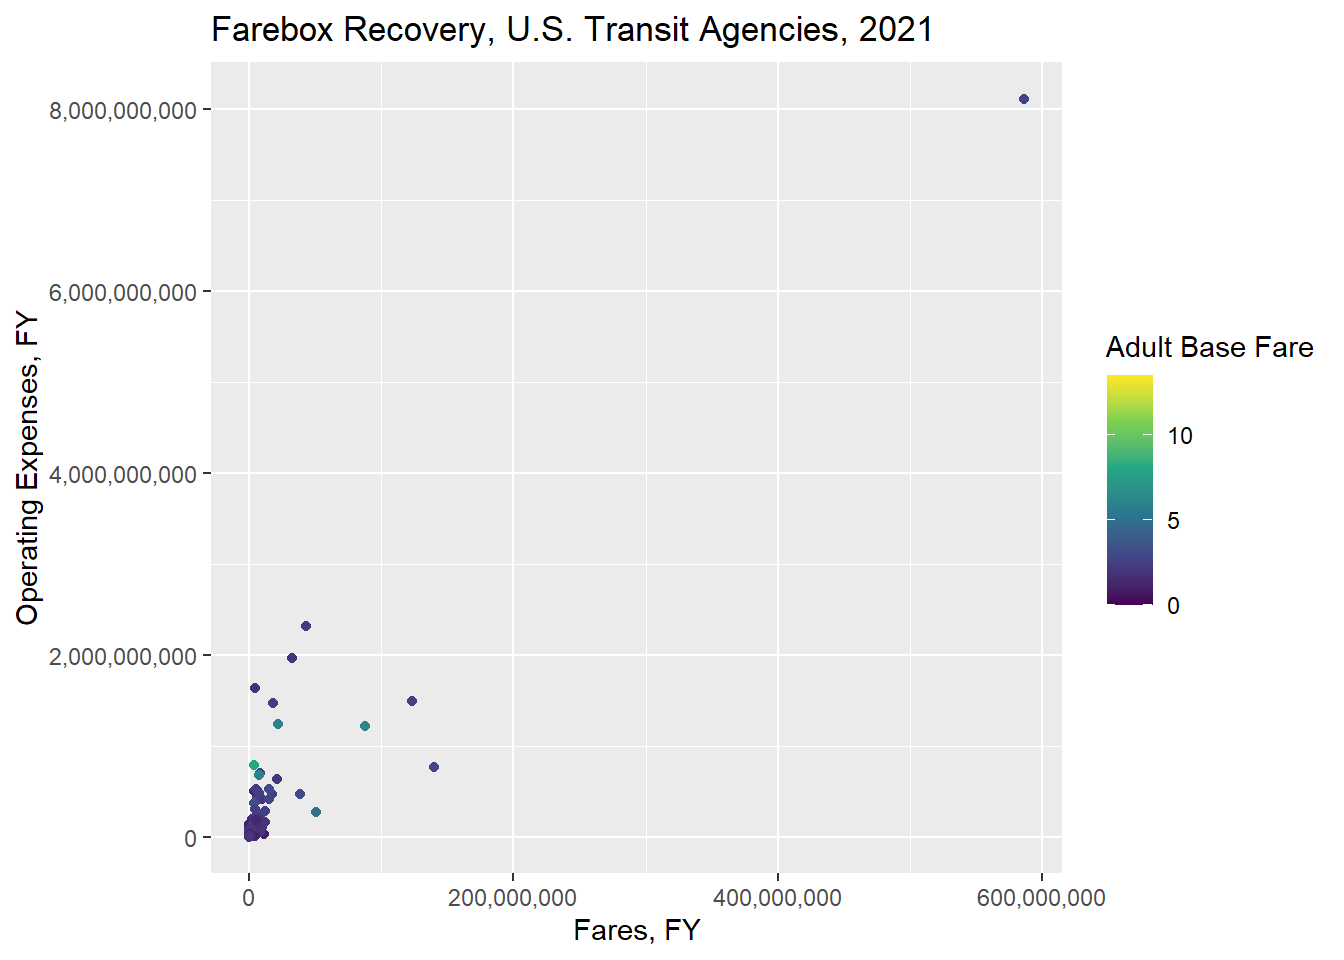
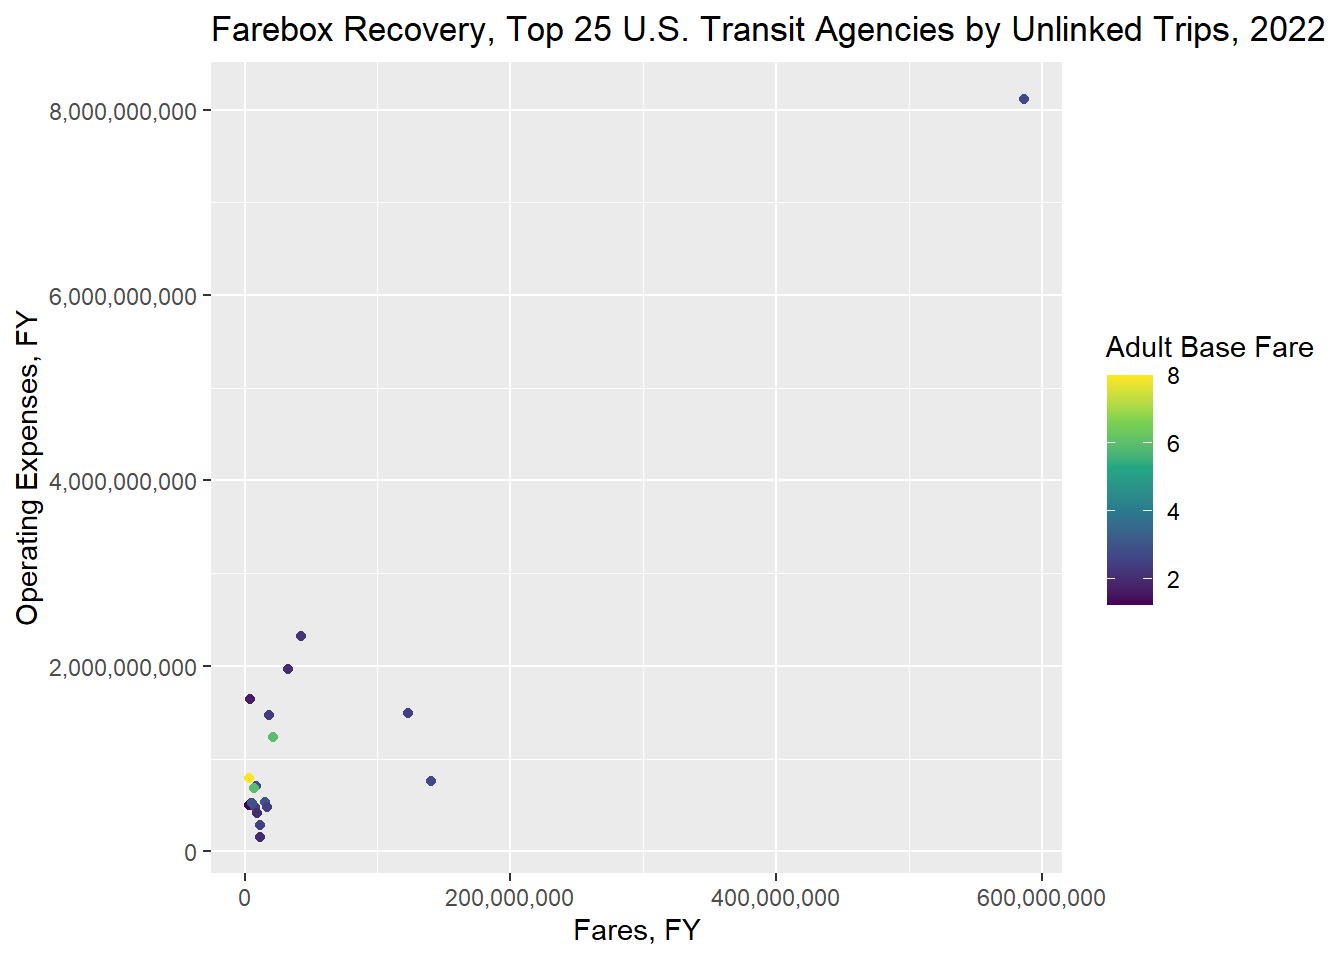
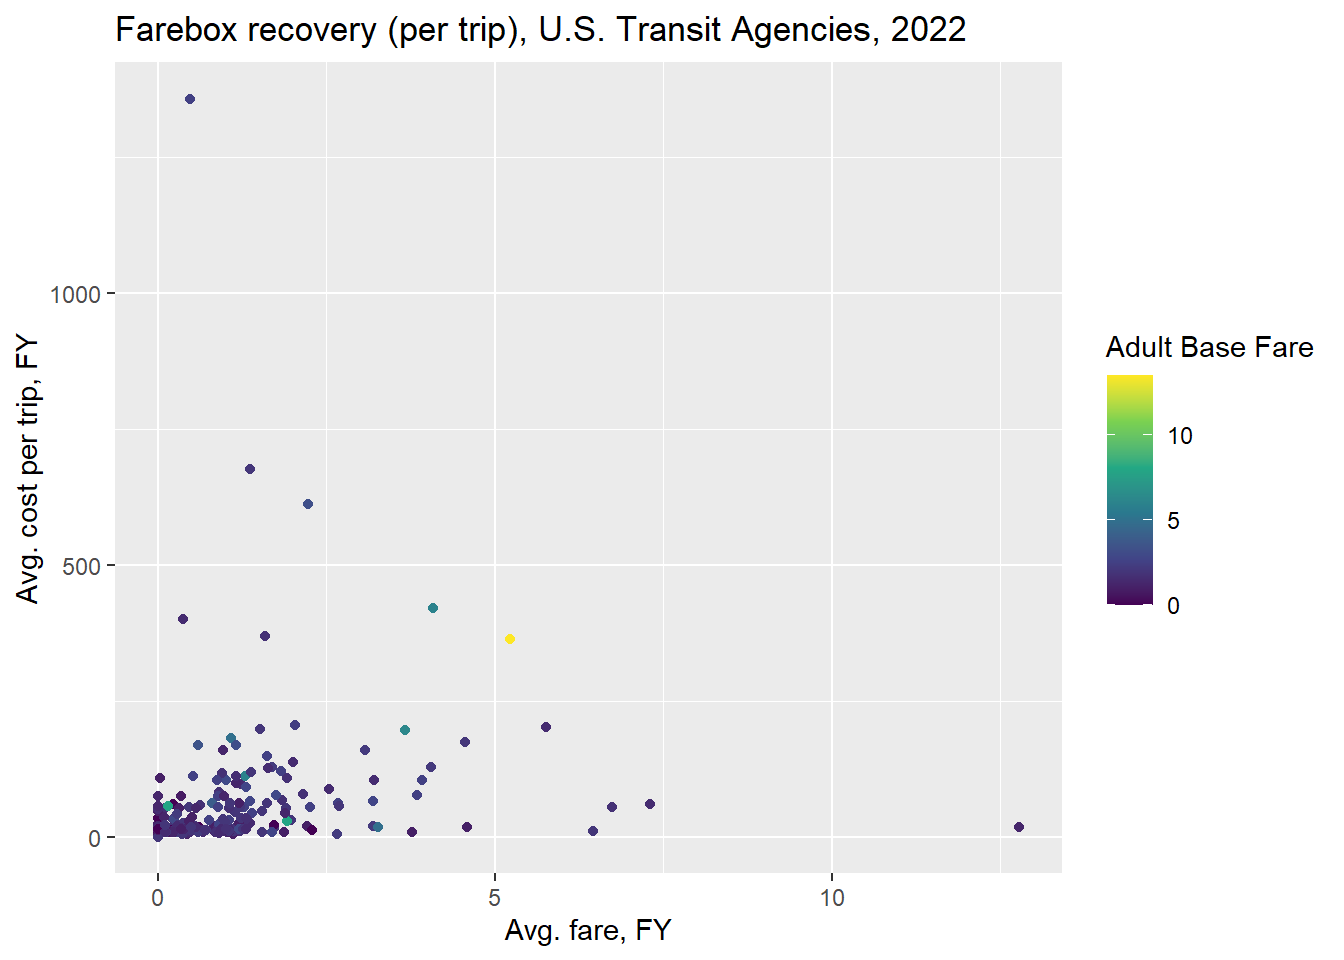
I will highlight these outliers in a subsequent report, but the agency with the highest cost per trip in the third chart is our own MDOT MTA and the agency with the highest operating expenses in the first two plots is, naturally, NY Metro. Maybe I will normalize these values in a future analysis.
Next, we will read in the National Transit Map shapefile and join our combined APTA and NTD data to it using NTD ID.
ntd_sf <- st_read("../data/National_Transit_Map_Agencies.shp")Reading layer `National_Transit_Map_Agencies' from data source
`C:\Users\farep\Documents\687\Labs\Final\data\National_Transit_Map_Agencies.shp'
using driver `ESRI Shapefile'
Simple feature collection with 520 features and 9 fields
Geometry type: POINT
Dimension: XY
Bounding box: xmin: -17572310 ymin: 2076947 xmax: -7360426 ymax: 9560340
Projected CRS: WGS 84 / Pseudo-Mercatorntd_sf_apta <- inner_join(ntd_sf, apta_ntd, join_by(Participat == `NTD ID`))
mapview(ntd_sf_apta)nrow(ntd_sf_apta)[1] 172We managed to match 172 rows between the joined NTD and APTA fares tables, and the National Transit Map. Not too bad. I will eventually provide a full accounting of “missed” rows. It appears that a number of agencies either have not shared their published GTFS with the FTA; there also may be a few values in the Participat column of the NTD Map that have commas or semi-colons. I will eventually clean these and re-attempt the join.
The quick map using mapview shows locations of all successfully joined agencies. Hovering over the points will present you with a load of data (all 71 variables in the table). We will export change how these attributes are presented in QGIS. For the finished webmap, check out the link on my portfolio.